At Mountain Warehouse we’ve been offering unbeatable value for money and outstanding quality since we opened our first store in 1997.

Mountain Warehouse is proud to employ over 3500 colleagues across the globe. We offer opportunities across our Head Offices in London and Coventry, our stores around the globe, including the UK, Europe, United States, Canada and New Zealand and a remote working Customer Care team. We ship to over 30 countries from our 11 UK and International websites and we have a growing family of over 4 million customers.
Our results show progress from last year where our mean hourly pay gap has narrowed. Improving our diversity remains a priority and we continue to focus on initiatives that make a meaningful difference to achieving that goal.
In the last year, we have promoted 324 retail colleagues, 52% of whom were female. In Head Office we promoted 48 colleagues across different departments and 60% were female. We encourage career development and we have over 50 colleagues studying on apprenticeships across Retail, Finance, Buying and Merchandising and IT, at levels 3,4,5 and 7.
We are committed to supporting women in the workplace and recently launched a full Menopause policy and guidance for all of our colleagues, alongside an app that gives specific support and guidance for women going through menopause in supporting symptoms.
We celebrated International Women’s Day this year by teaming up with Rhiane Fatinikun MBE, founder of Black Girls Hike, where she has made a hugely positive impact for women and diversity in the outdoors, alongside holding our first women’s network session with our female colleagues from across Mountain Warehouse. In addition, this year we have partnered with social mobility charity, Career Ready to give opportunities to our teams to mentor young people to create a positive initial work experience.
I am proud to lead the talented team at Mountain Warehouse. We gain strength from the diversity of our workforce and we strongly believe in equality for all and that includes equal pay for equal jobs and equal opportunities for all colleagues.
I can confirm that our gender pay gap statement is accurate and correct as at 4th April 2024.

Mark Neale, Founder
100% of Mountain Warehouse colleagues are paid equally for doing equivalent jobs.
Gender make up in our UK business
The proportion of female & male colleagues
| 2023 | 2022 | |
|---|---|---|
| Proportion of Women in Head Office roles | 59% | 60% |
| Proportion of Women in Retail roles | 57% | 59% |
Gender Pay Gap
The median and mean average differences in ordinary pay for all female & male colleagues
| 2023 | 2022 | |
|---|---|---|
| Median hourly wage of women | 1.8% lower |
1.2% lower |
| Mean hourly wage of women | 9.41% lower |
12.3% lower |
Gender splits by Pay Group Quartiles
The proportion of male and female colleagues according to quartile pay groupings are shown below.
2023
Males Females
| Upper Quartile | 49.7% | 50.3% |
| Upper Middle Quartile | 42.8% | 57.2% |
| Lower Middle Quartile | 36.5% | 63.5% |
| Lower Quartile | 41.6% | 58.4% |
2022
Males Females
| Upper Quartile | 49.7% | 50.3% |
| Upper Middle Quartile | 36.7% | 63.3% |
| Lower Middle Quartile | 37.6% | 62.4% |
| Lower Quartile | 38.3% | 61.7% |
Bonus Pay
The median and mean average differences between bonus pay for female and male colleagues.
| 2023 | 2022 | |
|---|---|---|
| Median bonus pay gap | 4.6% | 43.8% |
| Mean bonus pay gap | 20.5% | 49.4% |
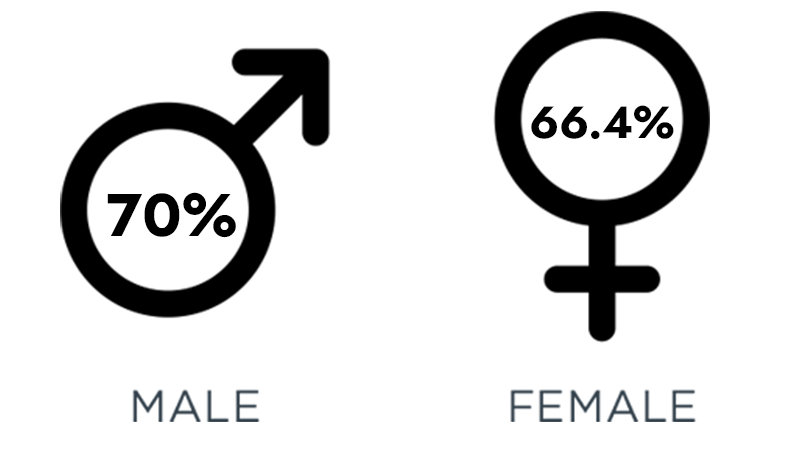
The proportion of male and female colleagues who received a bonus


